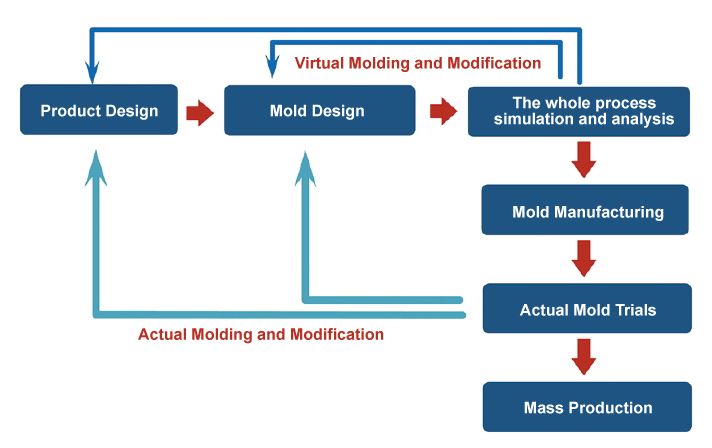
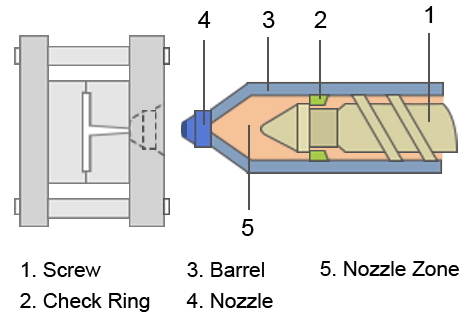
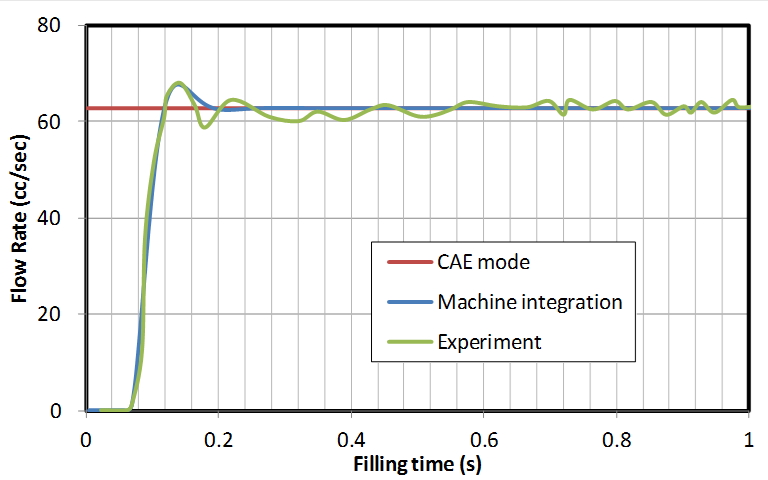
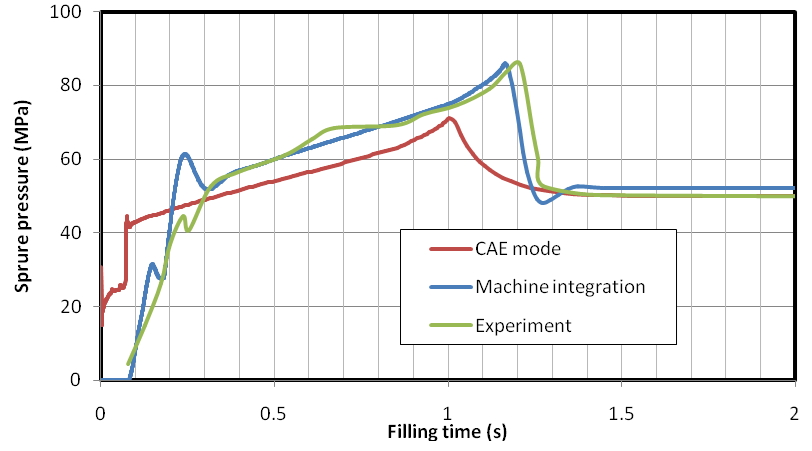
The core of Industry 4.0 is a Cyber-Physical System. Currently, the most well-known method of interpreting the real injection molding process is through virtual models using mold filling simulation technology. It is used to transfer all of the elements in injection molding into a virtual system, in which, the calculation of the product quality and production efficiency will be applied in the physical space for further manufacturing decisions. The process is shown in Fig. 1. During the comparison of the injection molding and simulation results, the most key procedure is to make the input data in the simulation consistent with the real injection process. The possible factors of inconsistency include the speed of machine response, the material property control, the data measure methods, and product geometry consistency, etc. [2]. If we ensure the correction of the input data, the simulation analysis results can be highly consistent with the actual results and bring comprehensive in-mold calculation data, which is useful for product design optimization. In the comparison of the injection pressure, after ensuring the consistency between the geometry and actual molding, we will face the challenges of how to establish the material viscosity model and attain the parameters. In the material viscosity model, the temperature, shear rate, and pressure effect during the engineering process should all be taken into account. During the whole process, one of the most important issues is the machine movement modeling. In an injection unit, the screw contains an injection zone, a plasticization compression zone, and a metering zone. As shown in Fig. 2, the solid plastics are moved forward to the nozzle through the screw rotating and retreating. During this procedure, the plastics will melt and accumulate at the screw head for injection. In the screw head and nozzle area, the viscosity and PVT of the plastic will obviously change due to high temperature and compression. If the injection packing simulation considers the factors, we can attain better inlet condition interpretation and pressure peak value prediction. Moldex3D introduced the barrel zone compression concept in the software very early [3]. It calculates the density compression factors through the dynamic compression elements based on the PVT changes of the materials, and generates a formula of conservation of mass in this area during the filling and packing process: In the formula, Ï represents the material density, V represents the barrel volume, t represents the time at this step, t+â–³t represents the time at the next step, and FR represents the flow rate value of the nozzle. The calculation results are shown in Fig. 3. Since the material-specific volume is affected by the compression at the screw head, there will be a gap between the simulated and actual flow rates when the melt flows through the barrel and nozzle. The gap will be particularly obvious when material compression has a huge change, or the product is tiny and precise. Moldex3D has efficiently eliminated the gap based on the introduction of the formula mentioned above. Also, this simulation technology has been successfully applied in the real cases of our customers for the prediction of the pressure changes in the filling process [4]. As for the machine screw movement parameters, in the traditional simulation, the screw movement is simply transferred into the speed and pressure imposed on the melt. This has oversimplified the melt flow behaviors. Take a closed-loop hydraulic injection machine as an example, at the actual injection stage, in order to eliminate the difference between the measured speed and the speed imported by the molding staff, the machine will adjust the proportional valve through the controller to increase or decrease the screw speed. The response speed of the control loop will decide the production stability of the machine. Moreover, the machine response speed is a non-linear model. Therefore, how to include the machine response factor in the simulation analysis is always a challenge when the users are setting the conditions. In the new version of Moldex3D, users can set the filling speed and pressure response, and validate the machine response parameter model through the experimental method. Thus, the real machine response can be considered in the mold filling simulation. As shown in Fig. 3, at this flow rate setting segment, traditional CAE mode can only display the single flow rate prediction. On the contrary, through machine integration and injection speed verification, the flow rate change behaviors will be more consistent with the real machine. The flow rate delay behaviors at the earlier stage can also be predicted. By integrating the barrel compression effect on the melt at the screw head during the packing process, Moldex3D can also simulate the transient pressure behaviors of the material while it passes the barrel and nozzle. In addition, the injection pressure can be simulated through the integration of the machine response parameterization model and the material compression effect of the melted polymer. The predicted injection pressure differences under different calculation methods are shown in Fig. 4. As stated previously, since the traditional CAE mode simply considers on segment of the machine changes, the predicted injection pressure will not be consistent with the experimental results. On the other hand, if the simulation considers the machine parameter response and the barrel compression effects, the predicted injection pressure curve can be significantly modified. The simulated value is 89.95MPa, close to the actual value 85.81MPa. The predicted packing switch point (17.875mm) is also closer to the actual setting, 15mm. As the idea of Industry 4.0 is getting popular around the globe, the demands of the injection machine users are changing from an individual machine into automation, networking, and intelligence through the cyber-physical system. In this article, we demonstrate that when the machine response parameterization model and the melted polymer material compression effects are integrated into the simulation, users can more accurately predict dynamic behaviors of the materials while it flows into the mold and attains more precise injection pressure simulation results. Through this integration, the materials wasted in the trial-and-error process can be reduced, and overcome many challenges encountered in the frontline operation. References Heavy Duty Semi Trailers,Heavy Duty Hydraulic Dump Tipper Trailer,heavy duty dump trailers Shandong Tenda Vehicle Co. LTD , https://www.tendavehicle.comJim Hsu, Senior Director at the R&D Division of CoreTech System (Moldex3D)

Fig. 1 The new concept of the injection molded product [1]

Fig. 2 Different components inside the barrel region


Fig. 3 The flow rate changes considering the machine response parameter verification

Fig. 4 The injection pressure prediction results under different calculation modes
Barrel Compression on Application of Injection Molding Filling Analysis